Move to a New City
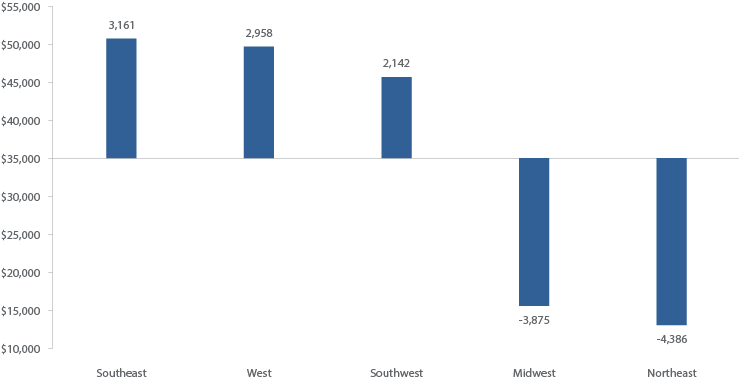
Westward Bound
2017 Total Net Shipments by U.S. Region (Source: Urban Van Lines)

How much does it cost to move?
The American Moving and Storage Association states that the average cost of an
interstate household move is about $4,300 (distance of 1,225 miles) and the
average cost of an intrastate move is about $2,300 (four movers at $200 per hour).
Both average moving costs are for 7,400 pounds. April 6, 2016.
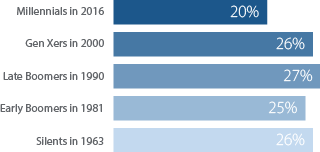
While Americans seem to be staying put a bit
longer these days, 20 percent of millennials said they were
likely to move in 2016.
Millennials are less likely to move than prior generations of young adults
% of 25- to 35-year-olds who moved in the previous year

Note: The migration rate refers to the share living at a different address one year earlier
Source: Pew Research Center analysis of Current Population Survey, Annual Social and Economic Supplements (IPUMS).
PEW RESEARCH CENTER
Population growth rates for educated millennials, or those
age 25 to 34 with a bachelor’s degree or higher
Educated Millennials Population Growth Rates in the
33 Largest U.S. Metro Areas, 2010-15
| Educated Millennials Core City Population Percentage Growth, 2010-15 |
Educated Millennials Metro Area (excl. core city) Percentage Growth, 2010-15 | Ratio of Core City Growth to Metro Area Growth, 2010-15 | |
| Chicago | 15.27% | 0.98% | 15 .62 |
| Austin | 50.33% | 5.59% | 9.01 |
| St. Louis | 33.69% | 3.97% | 8 .49 |
| Detroit | 78.29% | 10.88% | 7.19 |
| Riverside/San Bernardino | 31.68% | 4.42% | 7.16 |
| Las Vegas | 23.32% | 6.60% | 3.53 |
| Washington | 31.15% | 11.33% | 2.75 |
| Boston | 38.25% | 14.3 1% | 2.67 |
| Pittsburgh | 48 .47% | 20.94% | 2.31 |
| Columbus | 30.47% | 13.67% | 2.23 |
| Kansas City | 20.73% | 9.57% | 2.17 |
| Denver | 43 .85% | 21.14% | 2.07 |
| Atlanta | 26.41% | 13.11% | 2.01 |
| Orlando | 53.03% | 26.98% | 1 .97 |
| Cincinnati | 13.50% | 7.85% | 1.72 |
| Dallas | 34.30% | 20.21% | 1.70 |
| Phoenix | 26.24% | 15.70% | 1.67 |
| Miami | 42 .51% | 28.76% | 1.48 |
| New York | 20.81% | 14.19% | 1.47 |
| Baltimore | 26.28% | 17.98% | 1.46 |
| Seattle | 38.82% | 30.36% | 1.28 |
| Minneapolis/St. Paul | 19.03% | 14.9 1% | 1.28 |
| Cleveland | 15.61% | 12.96% | 1.20 |
| Philadelphia | 38.26% | 32.21% | 1.19 |
| Houston | 32.25% | 28.60% | 1.13 |
| Tampa/St. Petersburg | 24.18% | 23.32% | 1.04 |
| Los Angeles | 19.80% | 19.13% | 1.03 |
| San Diego | 27.20% | 27.49% | 0.99 |
| San Francisco/Oakland | 24.79% | 32.36% | 0.77 |
| Portland | 24.18% | 31.61% | 0.76 |
| Charlotte | 29.11% | 49.27% | 0.59 |
| San Antonio | 11.27% | 21.55% | 0.52 |
| Sacramento | 9.66% | 19.61% | 0.49 |